MIT6.828-Lab1
Introduction
Lab1 is split into 3 parts, the first part is designed to let us get familiar with x86 assembly language, the QEMU x86 emulator, and the PC’s power-on-bootstrap(引导程序) procedure. The second part test the boot loader for our 6.828 kernel. Finally, the third part delves into the initial template for out 6.828 kernel itself, named JOS.
Part1: PC Bootstrap
tips
- type ctrl+a & x to quit qemu
The PC’s Physical Address Space
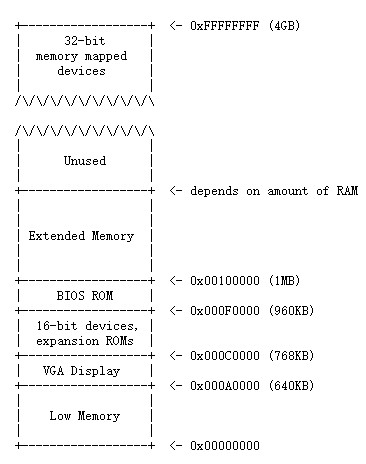
The general layout above belongs to 16-bit Intel 8088 processor(16 bit means the data bus width), which is capable of addressing 1MB of physical memory attributed by its 20-bit address bus. “Low Memory” is the only random-access memory(RAM) that an early PC could use. The left area(from 0x000A0000 through 0x000FFFFF) was reserved by the hardware for special uses such as video display buffers and firmware held in non-volatile memory. The most important part of this reserved area is the Basic Input/Output System (BIOS), which occupies the 64KB region from 0x000F0000 through 0x000FFFFF and is responsible for performing basic system initialization such as activating the video card and checking the amount of memory installed. After performing this initialization, the BIOS loads the operating system from some appropriate location and passes control of the machine to the operating system.
Considering x86 processors can support more than 4GB of physical RAM, so RAM can extend further above 0xFFFFFFFF. In this case the BIOS must arrange to leave a second hole in the system’s RAM at the top of the 32-bit addressable region, to leave room for these 32-bit devices to be mapped. Because of design limitations JOS will use only the first 256MB of a PC’s physical memory anyway, so for now we will pretend that all PCs have “only” a 32-bit physical address space.
The ROM BIOS
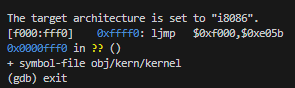
Open 2 terminal windows and cd both shells into my lab directory. In one, type sudo make qemu-gdb, which will starts up QEMU, but it stops just before the processor executes the first instruction. In the second terminal, type sudo make gdb. u will get the above result.
Some explanation
- the above line:
[f000:fff0] 0xffff0: ljmp $0xf000,$0xe05bis GDB’s disassembly of the first instruction to be executed.
- The IBM PC starts executing at physical address 0x000ffff0, which is at the very top of the 64KB area reserved for the ROM BIOS.
- The PC starts executing with CS = 0xf000 and IP = 0xfff0.
- The first instruction to be executed is a jmp instruction, which jumps to the segmented address CS = 0xf000 and IP = 0xe05b.
- formula
physical address = 16 * segment + offset, segment = PC, offset = IP. So, the physical address regerenced is: 16 * 0xf000 + 0xfff0 = 0xffff0. - why 0xffff0?
Obviously, 0xffff0 is 16 bytes before the and of the BIOS(0x100000), that’s because the first thing that BIOS does isljmpbackwards to an earlier location.
Part2: The Boot Loader
Program(boot.S and main.c) is the bootloader. It should be stored in the first sector of the disk.
why boot sector loaded at memory 0x7c00?
see other-blog
& where specify it? A: By -Ttext 0x7C00 to the linker in boot/Makefrag
Explanation about boot.S
To deeply understand boot.S, it’s better to see Appendix B in xv6-book.
1 | |
here, it’s important to emphasize why use ljmp instruction.
1 | |
here is the exact words in xv6-book:
Enabling protected mode does not immediately change how the processor translates logical to physical addresses; it is only when one loads a new value into a segment register that the processor reads the GDT and changes its internal segmentation settings.
One cannot directly modify %cs, so instead the code executes an ljmp (far jump) instruction, which allows a code segment selector to be specified. The jump continues execution at the next line,but in doing so sets %cs to refer to the code descriptor entry in gdt. That descriptor describes a 32-bit code segment, so the processor switches into 32-bit mode
role of disassembly
when we write a .s file, we want to set a breakpoint on a certain line, we need to use physical address provided by disassembly, and then use gdb.
1 | |
00007c00 <start>:means this code section starts at0x7c007c00: fameanscliinstruction starts at0x7c00andfais the opcode ofcli
some command about gdb
better to see GDB section in lab-gudie
b *<ADDR>:<ADDR>means the address where you wannna breaksi <N>:<N>means N stepsx/Nx <ADDR>: Display a hex dump of N words starting at virtual address addrx/Ni <ADDR>:<ADDR>is the memory address at which to start disassembling, and N is the number of consecutive instructions to disassemble
here is some results I tried: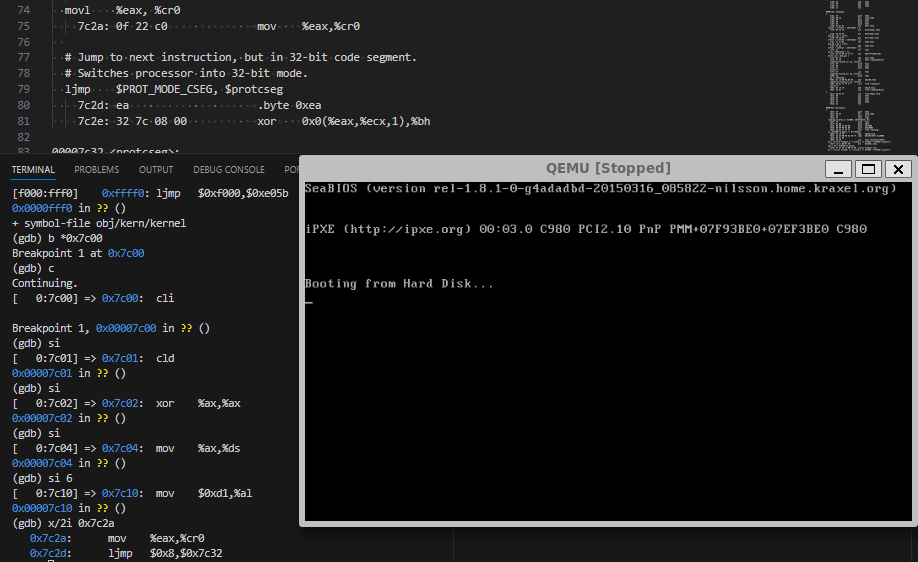
Exercise 3
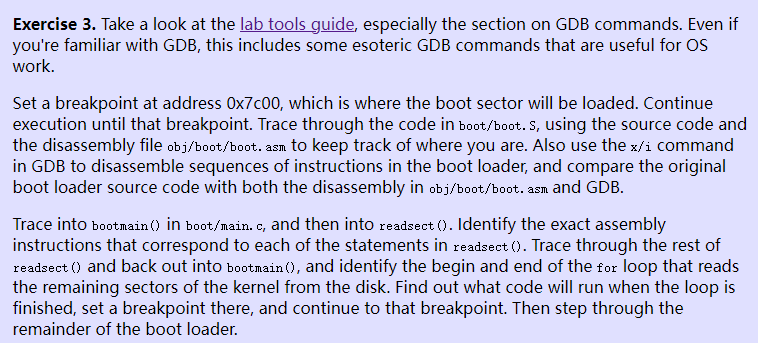
ans: the loop is finished at 0x7d71, which is showed by jae 7d71 <bootmain+0x58> instruction
And the kernel code seems to be at 0x10000c, here is some disassembly code after loop is finished
1 | |
questions
- At what point does the processor start executing 32-bit code? What exactly causes the switch from 16- to 32-bit mode?
- after
ljmpinstruction ljmp $PROT_MODE_CSEG, $protcseg, concluded by appendix B inxv6-book
- What is the last instruction of the boot loader executed, and what is the first instruction of the kernel it just loaded?
- last instruction of the boot loader:
0x7d71: call *0x10018 - the first instruction of the kernel:
0x10000c: movw $0x1234,0x472
- Where is the first instruction of the kernel?
0x10000c - How does the boot loader decide how many sectors it must read in order to fetch the entire kernel from disk? Where does it find this information?
ToDo: i don’t know-_-
Loading the Kernel
Exercise 4
a[b] <==> *(a + b)- for a pointer p, the offset of
p + 1depends onsizeof(p)
ELF
For now, what’s truly in my mind is an ELF executable is a header with loading information, followed by several program sections, each of which is a contiguous chunk of code or data intended to be loaded into memory at a specified address.
- LMA: The load address of a section is the memory address at which that section should be loaded into memory.
- VMA: The link address of a section is the memory address from which the section expects to execute.
- use
objdump -h obj/kern/kernelto see the full list of the names, sizes, and link addresses of all the sections in the kernel executable - Verification about
Where is the first instruction of the kernel:
useobjdump -f obj/kern/kernel, you will see the figure below: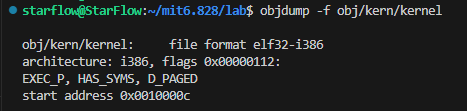
Part3: The Kernel
Using virtual memory to work around position dependence
First, we need to straighten things out. For backward compatibility, processcor starts at 16-bit mode, and we use bootloader to change it into 32-bit mode, which let us get into protected mode. But!!!, memory references are still treated as physical addresses, until kern/entry.S sets the CRO_PG(Page flag). Once CR0_PG is set, memory references are virtual addresses that get translated by the virtual memory hardware to physical addresses.
Exercise 7
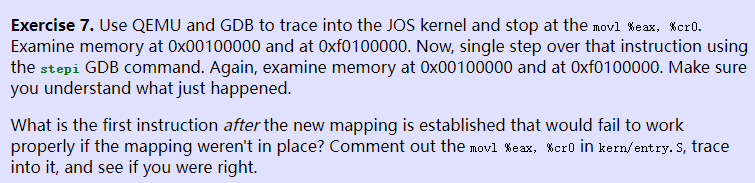
ATTENTION!!! the kernel has already been loaded at 0x10000c(Physical address), but until kernel.asm execute jmp *%eax to jump into the high address, can we use b *0xf0abcdef to break a point.
before movl %eax, %cr0, the memory is shown below:
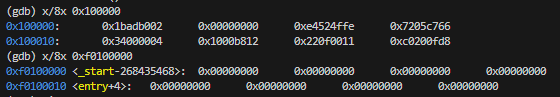
after that:
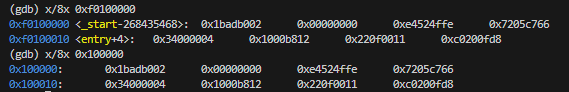
As we can see, memory started at 0x00100000 has been copied to 0xf0100000
AND, the first instruction that would fail should be some actions about accessing high address
Formatted Printing to the Console
printf() like function is not for granted!
Read through kern/printf.c, lib/printfmt.c, and kern/console.c, and make sure you understand their relationship. It will become clear in later labs why printfmt.c is located in the separate lib directory.
kern/console.c&kern/console.h
They exportscons_init()for init console,cons_getc()for get the next input character from console,kbd_intr()for handling keyboard interrupt,serial_intr()for handling serial port interrupt.printf.c&printfmt.cprintf.cencapsulate the functions inprintfmt.cintocprintf()for the entire program to print in console.- About
va_list,va_start,va_arg,va_endva_start(va_list args, type var), parametervaris the last certained parameter in the function which callva_start.va_arg(va_list args, type t), parametertdecides the way of translating parameter inargs.
Exercise 8
- fill the code fragment at
vprintfmtfunction inprintfmt.clike below:the result is:1
2
3
4
5// (unsigned) octal
case 'o':
num = getuint(&ap, lflag);
base = 8;
goto number;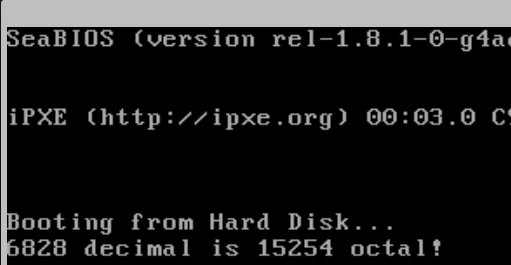
- Trace the execution of the following code step-by-step:in the call to
1
2
int x = 1, y = 3, z = 4;
cprintf("x %d, y %x, z %d\n", x, y, z);cprintf(),fmtpoint to0xf0101a92, andappoint to0xf010efd4, which reminds us that in C function, the actual parameters are pushed into the stack from right to left, evidence below:1
2
3
4
5
6
7
8
9// Lab Exercise8-3
int x = 1, y = 3, z = 4;
cprintf("x %d, y %x, z %d\n", x, y, z);
f01000e8: 6a 04 push $0x4
f01000ea: 6a 03 push $0x3
f01000ec: 6a 01 push $0x1
f01000ee: 8d 83 8a 17 ff ff lea -0xe876(%ebx),%eax
f01000f4: 50 push %eax
f01000f5: e8 4f 09 00 00 call f0100a49 <cprintf> - Run the following code.
1
2
unsigned int i = 0x00646c72;
cprintf("H%x Wo%s", 57616, &i);57616ise110in hex. And cause x86 is little-endian, so i is stored as0x72,0x6c,0x64,0x00which stands forrld\0inASCII.
Understand GCC calling conventions for JOS
delve into the code below
1 | |
The Stack
Exercise 9
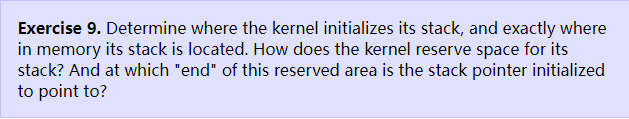
- At the
entry.S, we can see that kernel usemovl $(bootstacktop),%espto set location of stack to0xf010f000 - At the
inc/memlayout.h, we can seeKSTSIZEis8 * PGSIZEwhich used inentry.S - the stack pointer always points to the lower area
Exercise 10
watch Understand GCC calling conventions for JOS part, understand what i mentioned above
Something that we have to know about. When call some function, current instruction address(%eip) will be pushed onto the stack as the return address, and will set the eip to the right value. So, it explains why eip is always at the previous data before where the ebp points at in the stack
1 | |
Exercise 11
Implement a stack backtrace-1
As 74th line in entry.S says, the first ebp should be 0x0, which can be used for stopping the loop. The parameters has been pushed onto the stack before call instruction, so we can also find them by ebp
1 | |
Exercise 12
Implement a stack backtrace-2
- look in the file
kern/kernel.ldfor__STAB_*
as thekernel.ldsays below:the code above initiate the1
2
3
4
5
6
7
8/* Include debugging information in kernel memory */
.stab : {
PROVIDE(__STAB_BEGIN__ = .);
*(.stab);
PROVIDE(__STAB_END__ = .);
BYTE(0) /* Force the linker to allocate space
for this section */
}__STAB_* - run
objdump -h obj/kern/kernel
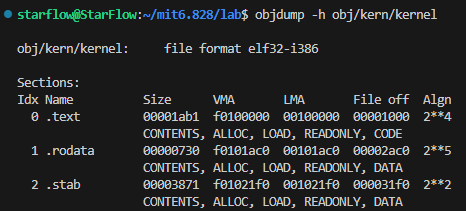
so the __STAB_BEGIN__ shoule be 0x001021f0, and the __START_END__ shoule be __STAB_BEGIN__ + SIZE.
- run
objdump -G obj/kern/kernel
to show the global symbol table of the execution. - run
gcc -pipe -nostdinc -O2 -fno-builtin -I. -MD -Wall -Wno-format -DJOS_KERNEL -gstabs -c -S kern/init.c, and look atinit.s. - see if the bootloader loads the symbol table in memory as part of loading the kernel binary
hmmm, maybe? - complete the
debuginfo_eiplike below:1
2
3
4
5
6stab_binsearch(stabs, &lline, &rline, N_SLINE, addr);
if(lline <= rline) {
info->eip_line = stabs[lline].n_desc;
} else {
return -1;
} - add new code to
mon_backtrace1
2
3
4
5struct Eipdebuginfo info;
if(debuginfo_eip(*(last + 1), &info) == 0){
cprintf(" %s:%d: %.*s+%d\n", info.eip_file, info.eip_line,
info.eip_fn_namelen, info.eip_fn_name, *(last + 1) - info.eip_fn_addr);
}